


↓ 30–60%
Regression cycle time
↓ 20–40%
Incident frequency
↓ 25–50%
Mean time to recovery
↑ 10–30%
Conversion or task success
↓ 15–35%
Infrastructure spend
Build faster. Run stronger. Spend smarter.
Bake speed, stability, and efficiency into your software delivery—end to end. From code to production, continuously test, observe, and tune so you can deploy faster, withstand peak demand, and cut cloud waste without risking user experience or uptime. If you’ve faced a recent major incident, are heading into a high-traffic event, migrating to microservices/serverless, wrestling with rising spend without better UX, or under executive pressure to meet SLOs—this is the moment to act.
We fix what matters: from SLA breaches and slowdowns at peak to incident recurrence and soaring cloud costs. Embed risk-based testing, pipeline gates, SLO-driven observability, chaos drills, and cost optimization into every stage—delivering faster, more resilient systems in under 12 weeks. Stop unpredictable latency, peak-event revenue risk, incident fatigue, and infrastructure waste before it costs you.
Performance engineering capabilities
PERFORMANCE VALIDATION
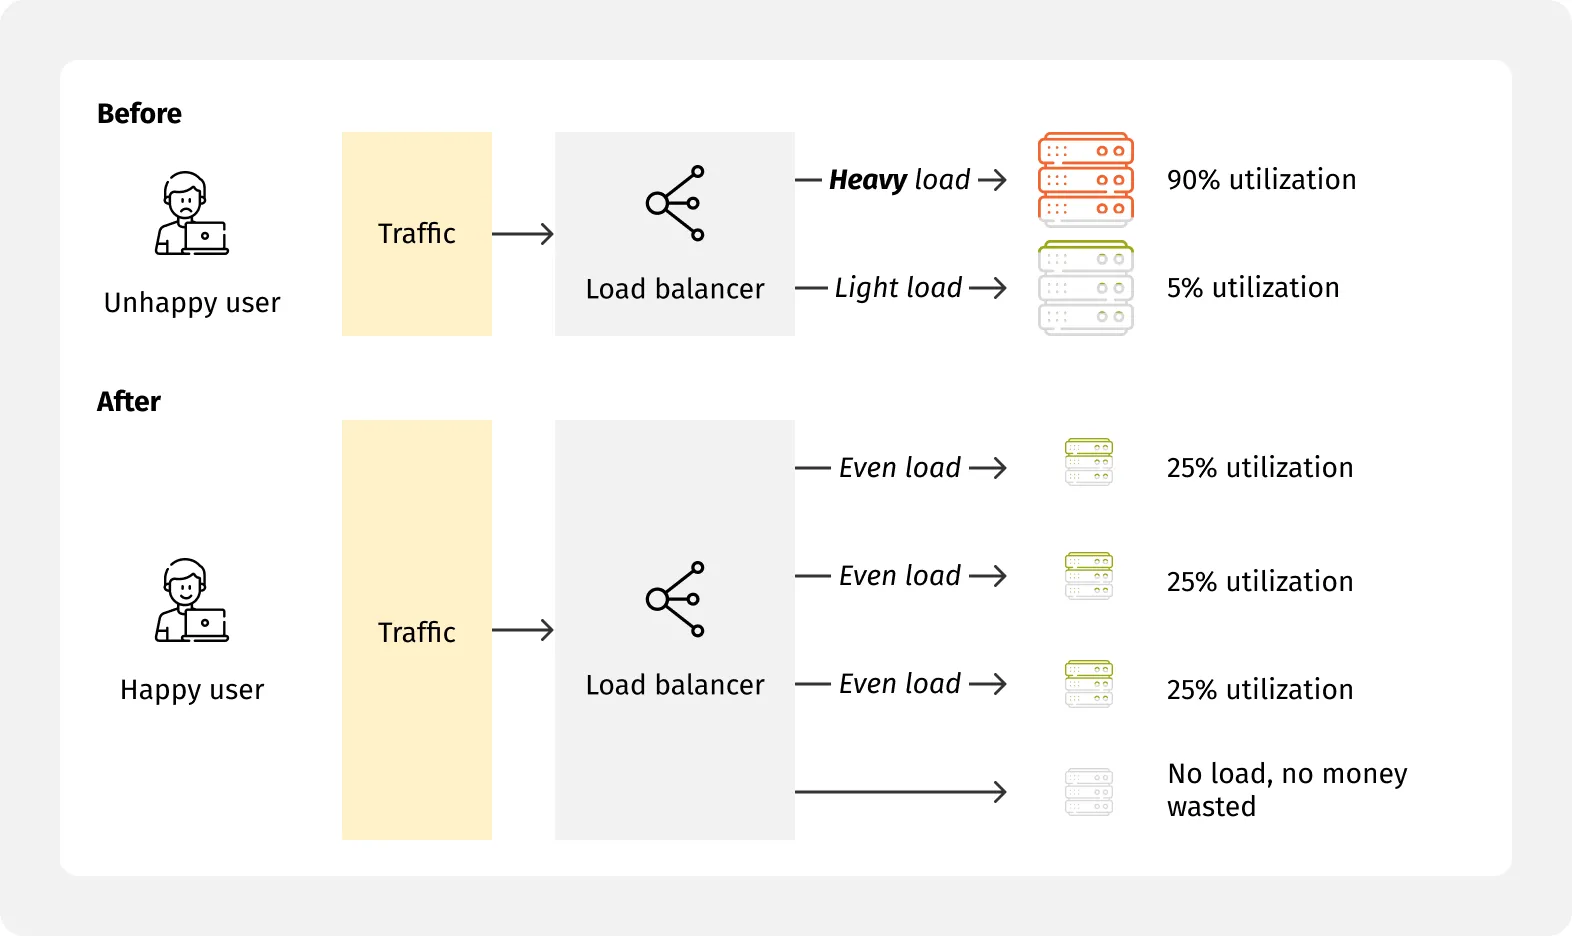
Validate scalability before it impacts business outcomes
Confidently handle peak loads by modeling real-world traffic mixes, running component and system-level load tests (API/UI, queues, data), and creating capacity models—with clear performance budgets for CPU, memory, I/O, and egress. This makes it easy to spot throughput, latency, and saturation limits before they reach customers.
RESILIENCE ENGINEERING
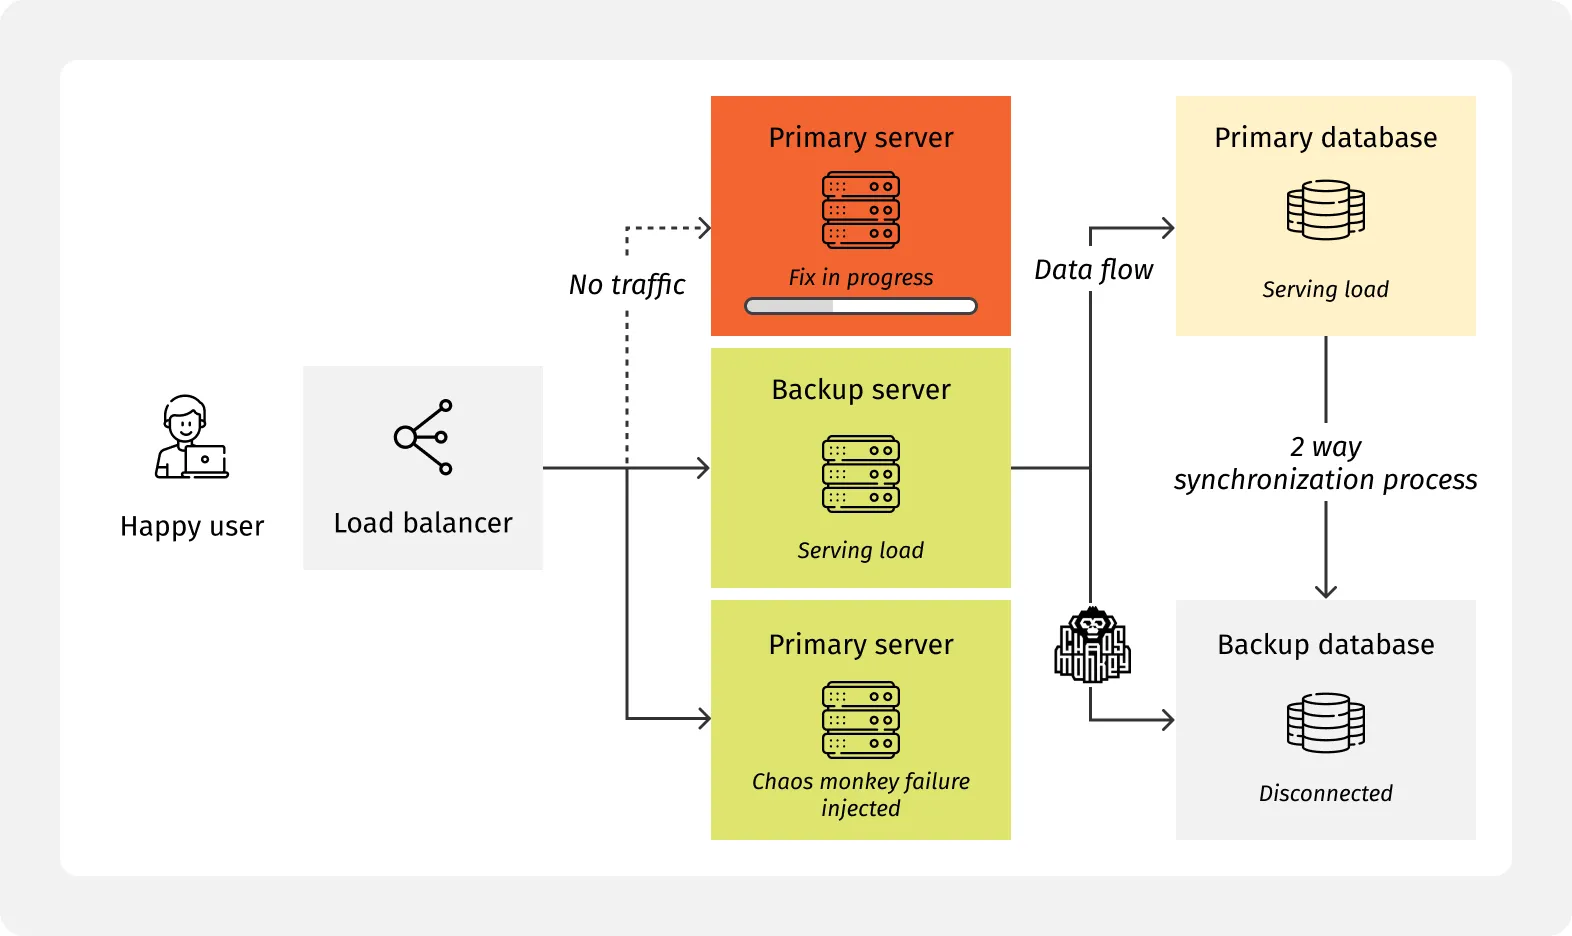
Engineer failure recovery and uptime into every system
Minimize disruption by injecting failures like network partitions, dependency slowdowns, and timeouts to prove auto-scaling, circuit breakers, and backpressure controls keep applications stable. Disaster recovery and failover drills with RTO/RPO validation ensure critical user journeys remain protected under stress.
SITE RELIABILITY MANAGEMENT
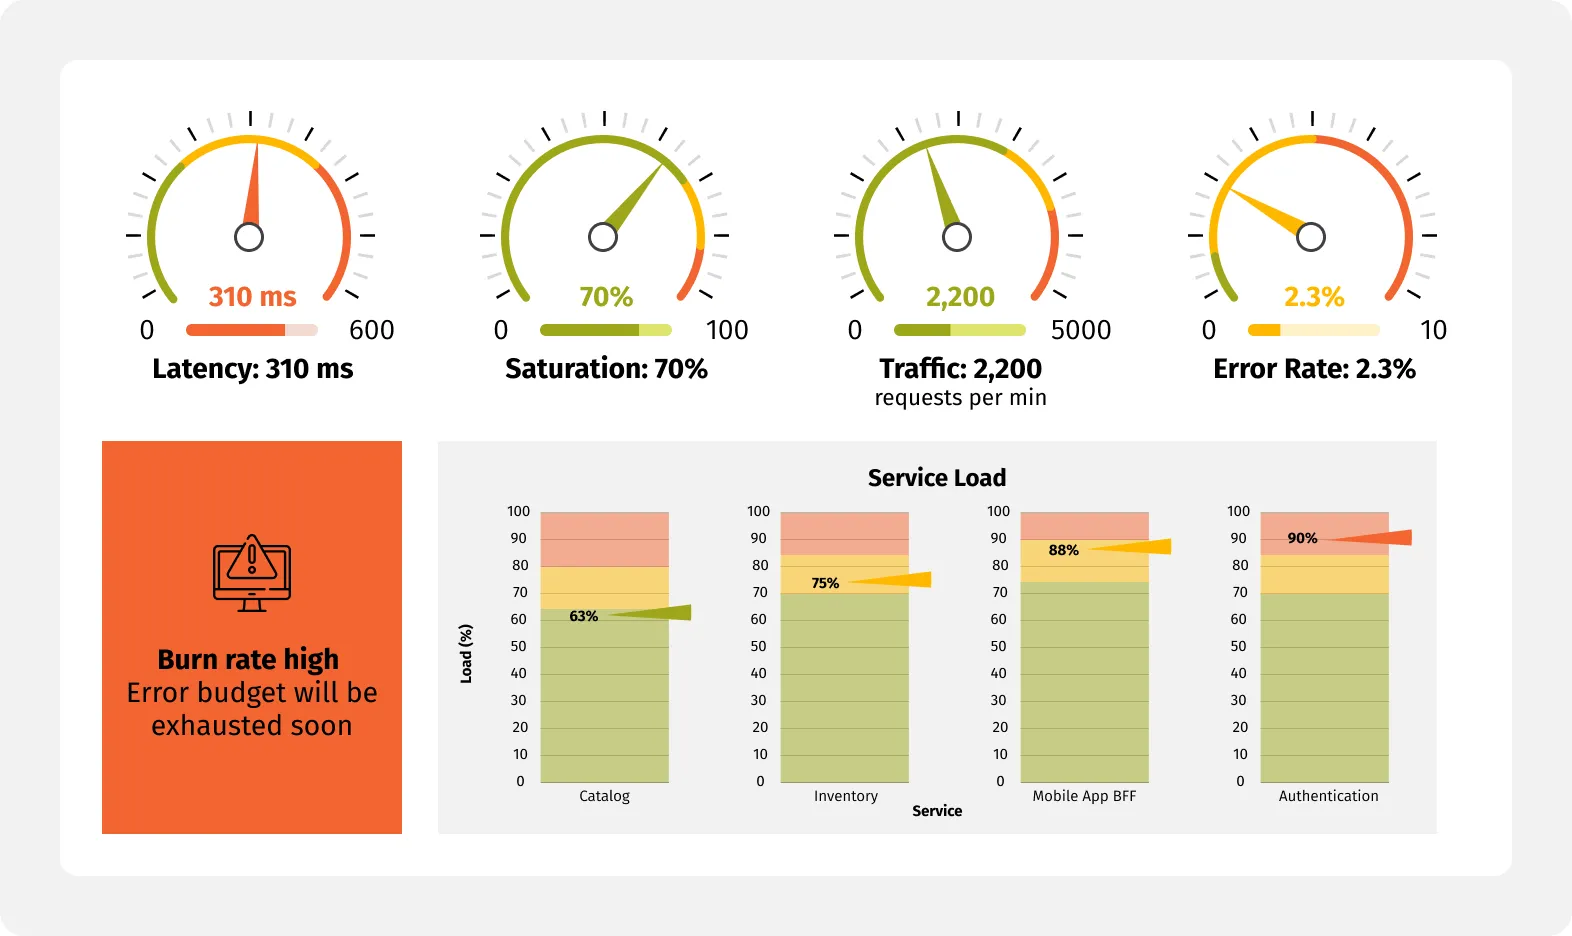
Turn service reliability into a managed contract
Achieve consistently high uptime by establishing SLOs and error budgets for key APIs and business flows, using golden signals dashboards (latency, traffic, errors, saturation) and burn-rate alerts to avoid surprises. Incident response playbooks and postmortems drive continuous reliability gains, not just fixes.
SYSTEM OPTIMIZATION
Pinpoint and eliminate performance bottlenecks across the stack
Deliver seamless customer experiences by combining deep profiling, tracing (flame graphs, spans, N+1 queries, GC tuning), and DB/cache optimization. Harness CDN, edge, and payload tuning to boost speed at all layers, ensuring your tech stack runs lean and fast.


COST-EFFICIENT PERFORMANCE
Optimize cloud spend without compromising SLAs
Control infrastructure costs proactively by rightsizing environments, leveraging autoscaling, and tapping into spot/preemptible instances. Track KPIs and perf/cost scorecards by service, and build capacity plans for peak events to ensure efficiency always aligns with business demand.
INTELLIGENT OBSERVABILITY
Surface actionable insights before users feel the impact
Achieve total system awareness via end-to-end tracing, metrics, and logs mapped to your service topology. Use synthetic monitoring, production-safe canaries, and real-time anomaly detection to catch regressions and resolve issues before they affect the customer experience.

Book a 30‑minute Performance Assessment
BOOK NOWSuccess stories
Global software company
-70%
SLA time on core service after in-depth tuning.
Ecommerce retailer
-30%
core web vitals and -35% infra cost on core endpoints via autoscaling.
Technology giant
<5 min
recovery time objective achieved for a 3-region failover drill, with SLOs and error budgets established for top services.
How we drive value, step by step
Assess & baseline
4-6 weeks
Map critical journeys, APIs, peak scenarios, recent incidents, and spend. Establish a baseline for latency, error rates, and SLO posture, capturing findings in a KPI map, risk matrix, and initial scorecard.
Design & plan
8-12 weeks
Set performance budgets and SLOs, define the test strategy, and identify pipeline gates and chaos plans. Document the approach with a test strategy, SLO policy, and chaos plan.
Enable pipelines & data
8-12 weeks
Build and automate load and chaos testing in CI/CD, stabilizing data and dependencies. Package everything into reusable scenarios, a test data/catalog, and quality gates.
Execute & tune
8-12 weeks
Run baselines, spikes, and soak tests; instrument tracing to detect bottlenecks; and verify system resilience. Track progress in profiling reports, a tuning backlog, and DR drill reports.
Prove value
8-12 weeks
Pilot the optimized flow, compare improvements to the baseline, and summarize impact. Illustrate value in a before/after dashboard and ROI summary for stakeholders.
Scale & govern
Quarterly
Roll out improvements service by service, embed governance with SLOs and runbooks, and test operational resilience in regular drills. Maintain progress using playbooks, scorecards, and a roadmap.
You provide
System context, environment and access, liaison team (Engineering, SRE, Product)
We provide
Architects, performance/SRE engineers, tooling setup, dashboards, and enablement
Technology & integrations
We integrate with your existing stack; tooling is selected per environment and objectives.
Load & performance | Chaos & resilience | Observability | Сloud & platform | Databases & Data Warehouses | Caching & Messaging | CI/CD & release |
|---|---|---|---|---|---|---|
 |  | |||||
 |  | |||||
FAQs
How fast will we see impact?
Assessments surface quick wins in 2–4 weeks; pilots deliver measurable improvements in 8–12 weeks.
Will this fit our toolchain?
Yes — our approach is tool‑agnostic and integrates with common CI/CD, observability, and cloud stacks.
Do you test in production?
We prefer pre‑prod for load tests and controlled prod experiments (canaries, synthetic flows) for safety.
How do you handle multi‑cloud or hybrid?
We design per environment; SLOs and tests are portable across clusters/regions/providers.
What about cost control?
We pair tuning with cost telemetry; every change is measured on both performance and spend.
How much continuous performance testing experience does Grid Dynamics have?
Grid Dynamics has pioneered continuous performance testing for years and even released its own open‑source tool, Jagger, back in 2011.
SDLC performance and reliability glossary
- SLO (Service Level Objective): reliability target for a service or user journey.
- Error budget: allowable unreliability before change must slow.
- Chaos engineering: deliberate failure injection to validate resilience.
- p95/p99 latency: 95th/99th percentile response time.
- Soak test: long‑duration test to detect leaks and degradation.
- Shift‑right testing: validating behavior and resilience in production contexts.
- MTTR: mean time to recovery/repair.
Our latest innovations in performance and resilience engineering


Accelerate your growth with proven digital transformation services
Digital transformation frameworks designed to modernize customer experiences