


AIOps tools
AIOps tools are a category of IT operations software that use artificial intelligence and machine learning to process, analyze, and act on the high volumes of data generated by modern IT environments.
Traditional monitoring tools primarily collect telemetry and trigger alerts when predefined thresholds or rules are met. AIOps tools go further. They ingest data from multiple sources simultaneously, including logs, metrics, traces, and events, and apply machine learning to find patterns, detect anomalies, and correlate related signals across systems. That correlation step is what separates them from standard monitoring. Instead of presenting hundreds of individual alerts from a single incident, an AIOps tool groups them, identifies the probable root cause, and routes the right information to the right team.
The practical outcome is a faster incident response and less time spent triaging noise manually. For large enterprises running distributed systems across cloud and on-premises environments, that difference is significant.
What do AIOps tools do?
At their core, AIOps tools solve a scale problem. Modern IT environments generate more observability data than any team can process manually, leading to overwhelming alert fatigue. Rather than replacing existing monitoring infrastructure, AIOps tools sit on top of it as an intelligence layer. They absorb this massive data volume and handle the analytical heavy lifting, allowing engineers to focus on resolving actual incidents rather than sifting through noise.
Core features of AIOps tools
What separates AIOps tools from traditional monitoring is not just the use of machine learning. It is the combination of capabilities that enables operations to move from reactive to proactive. The features below define what a mature AIOps tool should handle.
Data aggregation and normalization
Before any analysis can happen, AIOps tools need a complete picture of what is going on across the environment. That means pulling in data from every layer of the IT stack: application performance metrics, infrastructure logs, cloud platform events, network telemetry, and security signals. Each of these sources typically lives in a separate tool, in a separate format, with its own timestamp conventions.
Normalization is what makes this useful. Raw data from different systems rarely uses the same structure, making direct comparison difficult. By mapping incoming data into a consistent format, AIOps tools allow events from an APM platform and a cloud monitor to be evaluated side by side. While some advanced tools can draw connections without altering the original logs, structuring the data provides teams with a unified operational view across domains that previously lacked shared context.
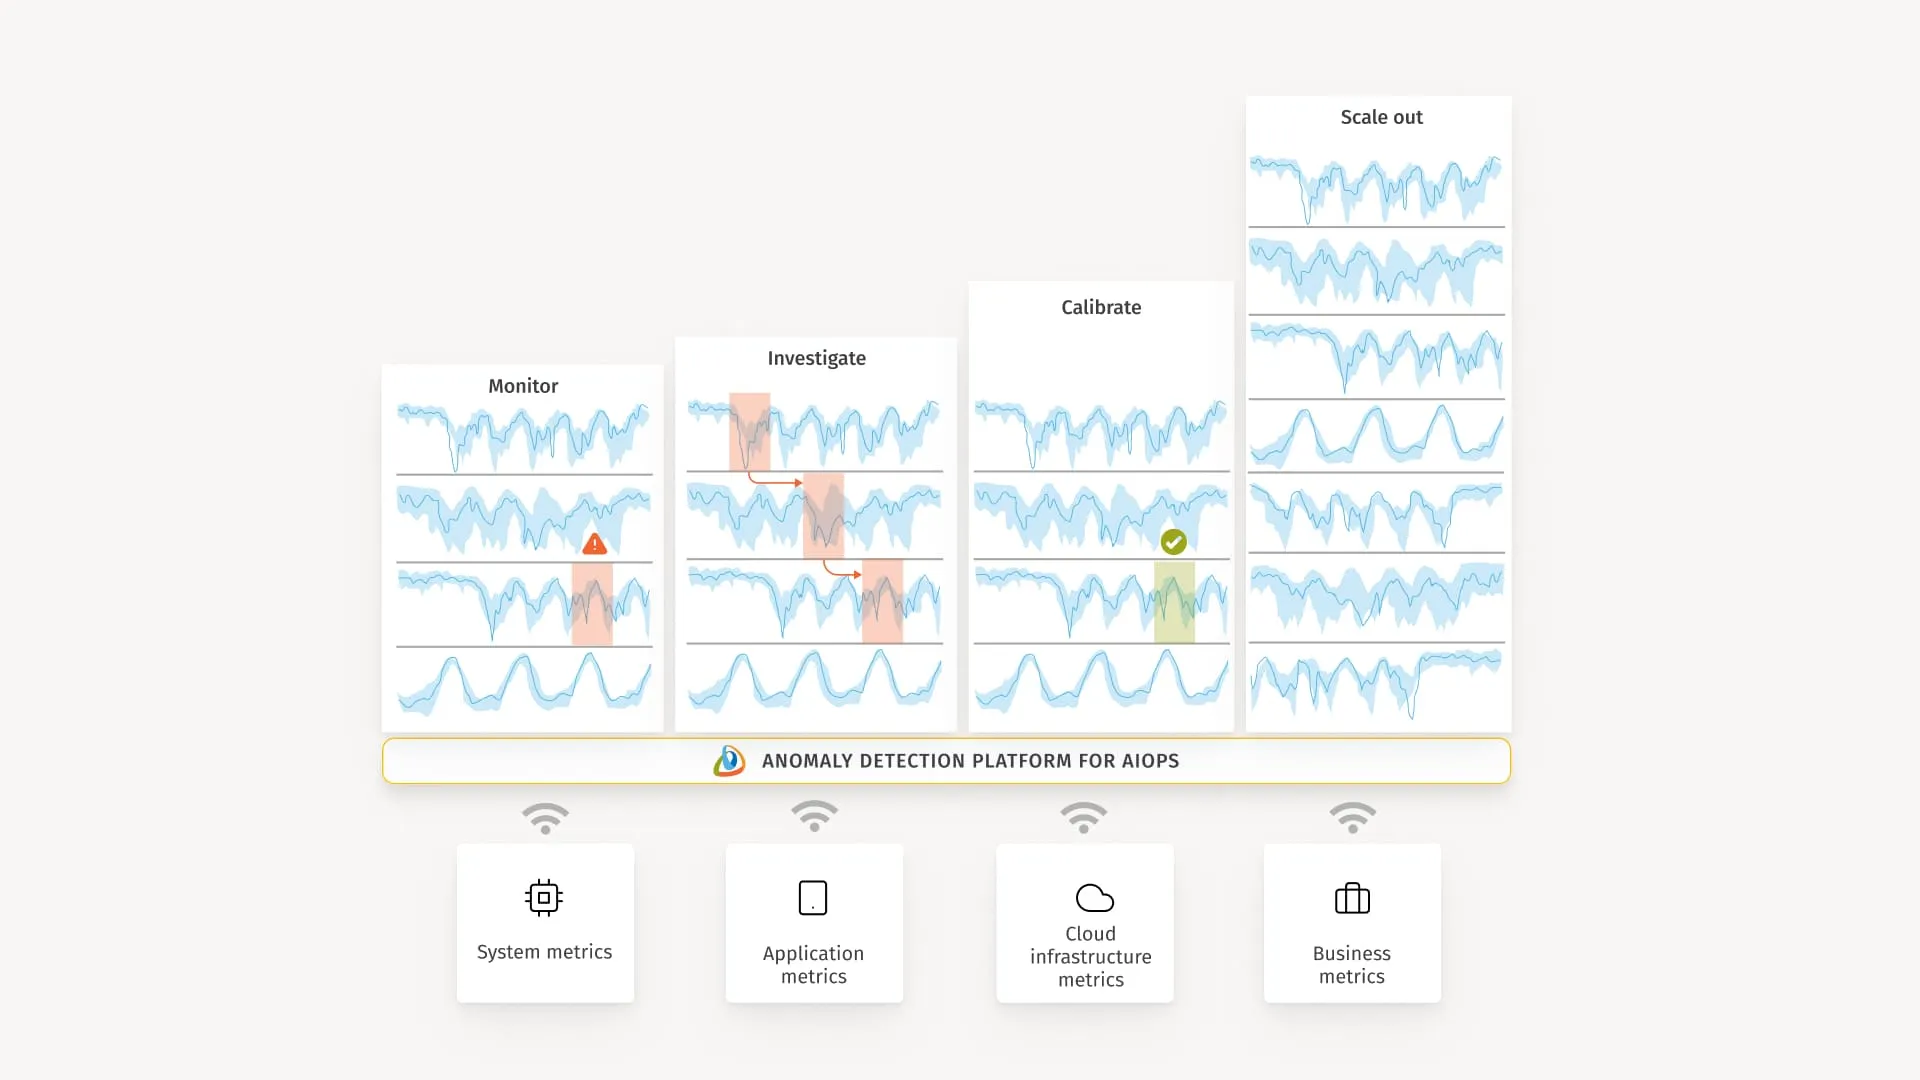
Anomaly detection
Static thresholds are a known weakness of traditional monitoring. They require someone to define what “normal” looks like up front, and they remain fixed even as system behavior evolves.
AIOps tools take a different approach. They build behavioral baselines from historical performance data and use machine learning models to detect deviations as they occur. This catches problems that rule-based systems miss:
- Sudden spikes that fall outside normal patterns but sit below a manually configured alert threshold
- Gradual drift, where performance quietly degrades over days or weeks before crossing any hard limit
- Seasonal variation, where expected traffic patterns differ by time of day, day of week, or business cycle, and alerts need to account for that context
The practical value is earlier detection with fewer false positives compared to fixed threshold monitoring.
Event correlation and alert noise reduction
When a database goes down, every service that depends on it fires an alert. A network issue in one availability zone can trigger hundreds of notifications across applications, APIs, and infrastructure simultaneously. Without a way to connect those alerts, an on-call engineer receives a flood of notifications that all look like separate, unrelated problems. This is alert fatigue, and it is one of the most consistent complaints in enterprise IT operations.
AIOps tools address this by deduplicating events and grouping related alerts into a single incident record. What would have been an alert storm becomes one actionable item with context already attached. This is especially valuable in microservices architectures and multi-cloud environments, where dependency chains are long, and a single failure point can generate noise across many systems at once.
Probable root cause analysis automation
Knowing that something is wrong is not the same as knowing why. Once events are correlated into an incident, AIOps tools use topology mapping and dependency analysis to work backwards from symptoms to origin. Topology mapping provides a live view of how services, infrastructure components, and dependencies connect. Dependency analysis traces which components were affected first and in what sequence.
Together, these produce a ranked list of probable root causes with supporting evidence. Engineers still make the final call, but they arrive at that decision with a structured diagnosis rather than starting from scratch. In a high-pressure incident, compressing that diagnostic phase directly reduces mean time to resolution.
ITSM and workflow integration
Detection and analysis are only useful if the right people are notified and can act quickly. AIOps tools integrate directly with service management systems like ServiceNow, Jira, and PagerDuty to close that gap.
When an incident is confirmed, the tool can automatically create a ticket, assign it to the correct team based on service ownership, and populate it with incident context, affected components, and probable cause. This removes the manual handoff between detection and response and keeps incident records consistent for post-incident review.
Automated remediation
The most capable AIOps tools extend beyond detection and analysis into automated response. For well-understood, repeatable incidents, this means triggering runbooks, executing remediation scripts, or initiating self-healing workflows without waiting for human intervention. A server running out of disk space, a service that needs a restart, or a scaling event triggered by traffic patterns are all candidates for automation.
The boundary matters here. Automated remediation works well for known failure patterns where the fix is predictable and safe to execute autonomously. For novel or complex incidents, the tool escalates with full context rather than acting on its own. Getting that boundary right is part of effectively configuring AIOps tools in a production environment and is typically governed by strict automation guardrails and operational policies that define exactly when the system is allowed to act.
In practice, this can look like a set of specialized agents working together.
- An alert response agent receives and classifies the incoming signal,
- An investigative agent runs a root cause analysis using logs, metrics, and documentation, and
- A runbook execution agent applies the matching fix under policy.
This kind of agentic AI architecture maintains human supervision in the loop while also compressing the path from alert to remediation from twenty-plus minutes to under five.
AIOps tools vs traditional network monitoring tools
Traditional network monitoring tools were built for environments where infrastructure was largely static, and changes happened during planned maintenance windows. They are excellent at polling devices, checking port status, and tracking bandwidth utilization against fixed rules.
AIOps tools represent a shift in how IT operations are managed, moving from simple data collection to intelligent analysis. The difference between the two approaches comes down to scale, intelligence, and action.
Feature | Traditional monitoring tools | AIOps tools |
Data scope | Siloed. Focuses mostly on network devices, traffic, and infrastructure metrics. | Unified. Ingests data across networks, applications, cloud platforms, and logs. |
Alert logic | Rules-based. Alerts fire when fixed, manually configured thresholds are crossed. | Model-driven.. Models learn normal behavior and flag meaningful deviations. |
Event correlation | Manual. Engineers must look across different dashboards to connect related alerts. | Automated. Groups related events across domains into a single incident record. |
Root cause analysis | Reactive. Provides raw data that an engineer must interpret to find the cause. | Probabilistic. Uses topology and dependency mapping to surface the most likely root cause. |
Response | Notification only. Sends an alert or email that an engineer must act on. | Automated remediation. Can trigger runbooks or self-healing scripts for known issues. |
The evolution here is not about replacing traditional tools entirely. It is about scale. When you manage thousands of microservices or hybrid cloud deployments, static rules generate too much noise. In many environments, AIOps tools often sit on top of the data collected by traditional monitoring platforms, adding the correlation and automation required to make sense of it.
Types of AIOps tools
Not all AIOps tools work the same way or solve the same problem. Some extend platforms teams already use. Others sit above the entire monitoring stack as a separate intelligence layer. And some are built specifically for service management or assembled from open-source components. The category a tool falls into shapes how it integrates with existing infrastructure and the operational maturity it requires.
Observability platform extensions
Many enterprises already run observability platforms that have progressively added AIOps capabilities on top of their existing telemetry and monitoring foundations.
Rather than adopting a standalone AIOps product, teams in this category get anomaly detection, correlation, and automated alerting built into the tools they already use. This is often the lowest friction path to AIOps adoption because there is no new data pipeline to build and no parallel system to maintain.
The trade-off is depth. Native AIOps features within observability platforms tend to be less customizable than dedicated tools, particularly for complex root-cause analysis or advanced automation scenarios.
Dedicated AIOps platforms
As covered above, observability extensions add AIOps features inside tools teams already use. But what happens when an enterprise runs five different monitoring tools across cloud, network, application, and security layers, and none of them talk to each other?
That is the gap that AIOps platforms fill. They typically do not replace monitoring tools themselves. They sit above the existing stack as an intelligence layer, connecting to the monitoring tools already in place and pulling their data into a single place for analysis. Think of them as the aggregation and reasoning engine that the existing tools are missing.
What they typically handle:
Capability | What it does in practice |
Multi-source ingestion | Connects to existing monitoring tools via APIs and pulls data into one analysis layer |
Cross-domain correlation | Groups related events from different systems into one incident record |
Workflow automation | Connects confirmed incidents directly to ITSM systems for faster response |
Root cause prioritization | Surfaces probable cause ranked by confidence, not just alert volume |
Tools like Moogsoft and BigPanda are commonly cited examples. They integrate with rather than replace existing infrastructure, which is why they qualify as a distinct tool type rather than just another monitoring platform.
ITSM-centric AIOps tools
ServiceNow and similar platforms take a different angle on AIOps. Instead of starting with observability data or monitoring tools, they build AIOps capabilities directly into the service management layer. The tool is the ITSM system itself, which has been extended with machine learning for incident handling.
This category exists because service desks are often the bottleneck in incident response, even when detection is fast. The added value is tight integration between incident signals and service workflows, without needing a separate AIOps layer. ServiceNow integrates with existing monitoring tools via APIs, pulls correlated alerts, and handles the rest natively.
What makes it different:
Where others focus | ServiceNow-style ITSM AIOps focuses |
Observability and correlation | Service desk workflows and ticket lifecycle |
Engineering response | Service ownership assignment and escalation |
External integrations | Native remediation workflows inside the ITSM platform |
This fits organizations with mature service management processes, where the main goal is to reduce manual ticket handling and improve response consistency across teams.
Building AIOps pipelines with open source tools
Not every organization wants to buy a packaged platform. Open source tools can be combined to build AIOps-like pipelines. These software stacks are highly customizable and typically managed directly by DevOps and SRE teams. They do not sit neatly in one layer of the IT environment. Instead, teams assemble them into custom pipelines using three core ecosystems as building blocks:
- Elastic ML: Anomaly detection built into Elasticsearch. For teams already using the ELK stack for log storage, this turns their existing data layer into an intelligent alerting engine without adding new software.
- Prometheus ecosystem: The standard monitoring foundation for Kubernetes. It handles metric collection and threshold alerting. While not a complete AIOps solution on its own, it acts as the primary data ingestion layer that dedicated AIOps platforms plug into.
- OpenTelemetry: A vendor-neutral standard for collecting traces, metrics, and logs. It does not analyze data, but it normalizes data collection across distributed systems so any downstream AIOps tool can work with it reliably.
The appeal here is total control and zero vendor lock-in. Teams can tune machine learning models to their specific environment and integrate exactly the data sources they need. The trade-off is engineering time: building, scaling, and maintaining these pipelines requires dedicated SRE resources that commercial options lack.
How AIOps tools integrate with existing monitoring systems
A common roadblock to AIOps adoption is the fear of a rip-and-replace project. Engineering teams spend years configuring their monitoring tools, and the idea of tearing them out to install a new platform is a non-starter.
The reality is that AIOps tools are designed with an overlay architecture. They do not replace your existing stack. They sit on top of it. Tools like Prometheus, Splunk, and Datadog stay exactly where they are, continuing to collect metrics and logs. The AIOps tool simply plugs into them to act as a centralized intelligence layer.
Here is how those connections are actually made.
Ingestion models
AIOps tools analyze data from across your IT environment to detect incidents, correlate events, and surface root causes. But to do that, they first need a reliable, continuous feed of what is happening across every system. That is where integration comes in.
Depending on how your monitoring stack is set up, AIOps tools connect through three models:
- API-based integrations – Your existing monitoring tools, whether that is an APM platform, a network monitor, or a cloud provider’s native tool, already have APIs that expose their alerts and event streams. AIOps tools connect directly to those APIs and subscribe to their output. This means AIOps gets a real-time feed of every alert your monitoring tools fire, without installing new agents or touching your infrastructure. The monitoring tools continue to do exactly what they do. AIOps just listens.
- Log and telemetry ingestion pipelines – Alerts only tell part of the story. Raw log data often contains early warning signals that never cross an alert threshold. AIOps tools connect directly to your existing log aggregators, such as Elasticsearch or a central Syslog server, and continuously scan those streams. This gives AIOps visibility into what is happening before a problem becomes an alert, which is important for catching gradual degradation that rule-based monitoring misses entirely.
- Standardized telemetry frameworks – Many environments use OpenTelemetry as a standard for collecting and structuring data across applications. If your environment already uses this standard, AIOps tools integrate simply by subscribing to that existing feed. The AIOps tool gets the structured data it needs for its machine learning models without requiring any changes to your underlying application code.
Cloud and container compatibility
Modern applications do not sit still. They scale up, move across regions, and spin down based on demand. AIOps tools have to integrate with dynamic environments where IP addresses and service locations change constantly.
Environment | How AIOps integrates |
Kubernetes & microservices | Connects to the Kubernetes API to map service dependencies dynamically as pods spin up and down. |
Cloud provider native tools | Ingests telemetry directly from AWS CloudWatch, Google Cloud Monitoring, and Azure Monitor. |
Hybrid and multi-cloud | Aggregates data from on-premises servers and multiple cloud providers into a single, unified view. |
This dynamic mapping enables an AIOps tool to trace a failure from the exact microservice back to a failing pod in a multi-cloud cluster with minimal human input.
Closing the loop with ITSM
The integration chain does not end at analysis. Once the AIOps tool has correlated events and identified a probable cause, that information needs to reach the team responsible for fixing the issue. This is where integration with ITSM systems completes the picture.
AIOps tools connect to platforms such as ServiceNow, Jira, and PagerDuty via bidirectional APIs. Bidirectional means the data flows both ways:
- AIOps to ITSM: When the tool confirms an incident, it automatically pushes a structured package into the ticketing system. That package includes which services are affected, the timeline of events, and the probable root cause. No engineer has to manually create or populate the ticket.
- ITSM back to AIOps: When an engineer resolves the ticket in Jira or ServiceNow, that status update flows back to the AIOps tool automatically. The incident record closes on both sides, keeping the systems in sync without anyone having to switch between dashboards.
This matters for integration because without ITSM connectivity, the AIOps tool becomes a dead end. It can detect and analyze, but the output sits in a separate system that nobody checks during an active incident. Connecting it to the tools that teams already use for incident response is what turns analysis into action.
Challenges and considerations
AIOps tools solve real operational problems, but they also introduce their own set of challenges during and after adoption. Understanding these upfront helps teams set realistic expectations and avoid the most common implementation pitfalls.
Data quality requirements
Machine learning models are only as good as the data they train on. AIOps tools need clean, consistent telemetry from across the environment to build accurate behavioral baselines.
Common data problems:
- Incomplete instrumentation: Some services or legacy systems send no telemetry at all
- Inconsistent formats: Different tools use different schemas for the same metric type
- Sparse historical data: New services lack enough history for the model to learn normal patterns
Without addressing these gaps, anomaly detection produces unreliable results, and correlation becomes guesswork. Teams often spend more time cleaning data than benefiting from analysis during early implementation.
Integration complexity
While AIOps tools advertise “plug and play” integrations, reality is more nuanced. Connecting to legacy monitoring systems, custom applications, or non-standard cloud configurations requires engineering effort.
Challenge | Impact |
Legacy tool APIs | Some older monitoring systems have poor or undocumented APIs |
Custom applications | Homegrown services may not emit standard telemetry formats |
Network policies | Firewalls between tools block the data pipelines AIOps needs |
The good news is that most commercial AIOps platforms include pre-built connectors for popular tools. Custom integrations still require dedicated time from platform engineering teams.
Model tuning and maintenance
AIOps tools rarely work optimally out of the box. Machine learning models need tuning to match specific environment characteristics, and they degrade over time as systems evolve.
Teams must regularly:
- Adjust sensitivity: Too aggressive, and you get alert fatigue; too conservative, and real issues get missed.
- Update baselines: After major releases or infrastructure changes, models need to be retrained.
- Validate outputs: Early correlation results often need human review to build trust in automation.
This ongoing responsibility falls upon SRE or platform engineering teams, and in mature organizations, it sits within a broader MLOps practice that governs model versioning, retraining cycles, and performance tracking.
Organizational change management
Technical integration is only half the battle. AIOps adoption requires engineers to trust machine-recommended root causes over their own manual analysis, at least initially.
Cultural hurdles:
- Alert fatigue skepticism: Engineers doubt automated correlation will catch what they might miss
- Automation resistance: SRE teams hesitate to let scripts execute without human review
- Process ownership: Incident response workflows change, creating turf battles between operations and platform teams
Success depends on starting small, proving value on low-risk workloads, and gradually building trust through consistent results.
Cost considerations
AIOps tools carry three main cost components that enterprises often underestimate:
- Licensing: Per-node, per-user, or data ingestion volume pricing models
- Engineering: Data pipeline configuration, model tuning, and ongoing maintenance
- Storage: High-resolution historical data needed for ML baselines consumes significant capacity
ROI typically appears after 6-12 months when MTTR reductions and toil savings start compounding. Early implementations focused on high-pain areas like alert storm reduction show value the fastest.
How AIOps tools fit into modern SRE and observability strategies?
SRE and observability practices were built around a core idea: if you cannot measure it, you cannot manage it. Observability gives teams visibility into system behavior through metrics, logs, traces, and related telemetry. SRE turns that visibility into reliability targets through error budgets (the budget for allowable downtime or failure a site or service can afford before it begins to upset customers), service level objectives (SLO: targeted rate of success), and systematic toil reduction.
AIOps tools do not replace either discipline. They extend both.
Where does AIOps fit in the observability layer?
Observability tools answer the question: what is happening in my system right now? AIOps tools answer the next question: what signals are related and where the problem likely originates?
The two work together in sequence:
- Observability platforms collect and surface raw telemetry, giving engineers full visibility into system state
- AIOps tools analyze that telemetry at scale, applying machine learning to identify patterns, correlate events, and prioritize what needs attention
Neither replaces the other. Removing observability from the stack would leave AIOps with nothing to analyze. Running observability without AIOps leaves engineers manually sifting through data at a scale that is no longer sustainable in complex cloud environments.
AIOps and the SRE model
SRE teams are measured against error budgets and uptime targets. Every minute spent manually correlating alerts or hunting for root cause is toil, and toil directly consumes the engineering capacity that should be spent improving reliability.
AIOps tools reduce toil in three ways that directly support the SRE model:
SRE practice | How AIOps supports it |
Error budget tracking | Automated anomaly detection can surface reliability degradations before they consume the error budget. |
Blameless postmortems | Root cause analysis outputs provide an objective, data-driven incident timeline. |
Toil reduction | Automated remediation addresses known failure patterns, allowing SREs to focus on systemic improvements. |
Scaling operations without scaling headcount
Cloud environments grow faster than operations teams can hire to support them. A team that comfortably managed a few hundred servers three years ago might now be responsible for thousands of containers spinning up and down across different cloud providers.
AIOps tools step in to absorb the sheer volume of data being generated. They act like a filter, letting the automated analysis handle the millions of data points so the engineers only see the handful of alerts that actually require human attention. That is why SRE teams adopt these tools. The goal is not to replace engineers; it is to ensure those engineers can still effectively manage an environment that has grown ten times larger than before.