

AIOps use cases
AIOps use cases describe how artificial intelligence and machine learning are applied to solve specific, recurring challenges in IT operations. AIOps use cases focus on the operational scenarios where Artificial Intelligence (AI) delivers measurable improvements: faster incident resolution, fewer false alerts, better capacity forecasting, and more reliable infrastructure overall.
Why are AIOps use cases growing in modern IT operations?
IT infrastructure has changed faster than the tools built to monitor it.
Five years ago, most production environments ran on a handful of servers with well-understood dependency chains. Today, a single user request might pass through a dozen containers, three cloud regions, and several third-party APIs before returning a response. Microservices replaced monoliths. Kubernetes replaced static VM provisioning. And the observability data generated by all of this has grown to a point where no human team can process it manually.
It’s not unusual for larger enterprises to run portfolios of five to fifty monitoring tools, each producing its own stream of alerts, metrics, and event data. That adds up to thousands of notifications per day, many of them duplicates, false positives, or symptoms of the same underlying problem. Engineers end up spending more time triaging noise than resolving actual incidents.
Rule-based monitoring was designed for a different era. It works fine for polling devices, checking port status, and tracking bandwidth against fixed thresholds. But it falls apart when systems scale dynamically, when “normal” looks different after every deployment, and when a single failure can ripple across dozens of dependent services.
The operational pressures driving AIOps adoption
- Cloud-native and microservices complexity. When a single transaction touches dozens of services across multiple infrastructure layers, tracing a failure back to its origin is not just slow. At the production scale, manual correlation becomes unreliable.
- Observability data overload. Every container, function, API call, and infrastructure event emits logs, metrics, and traces. In a medium-sized microservices deployment, this can mean millions of events per minute. The data exists. The problem is that no team can analyze it fast enough to act on it before users are affected.
- The failure of static thresholds. In dynamic environments where services scale up and down continuously, fixed thresholds generate too many false positives to be useful and miss gradual degradation entirely.
- The SRE reliability gap. SRE teams are measured against error budgets and uptime targets, but cloud environments grow faster than teams can hire to support them. Every minute an engineer spends manually correlating alerts or piecing together an incident timeline is capacity that should go towards improving reliability.
- The shift from reactive to predictive operations. Organizations are moving toward catching issues before they affect users, not after. That requires continuous pattern analysis across the full observability stack, a workload that is purpose-built for machine learning, not manual review.
Where does AIOps fit?
AIOps tools don’t replace observability or SRE practices. They add an intelligence layer on top of existing telemetry, automating the analysis and correlation work that currently consumes the most engineering time, so teams can focus on the handful of signals that actually need human judgment.
6 core AIOps use cases in IT operations
Across most enterprises, AIOps starts in a handful of high-impact workflows: reducing alert noise, finding issues faster, and automating the most repetitive runbook work. The use cases below reflect how real SRE and IT operations teams apply AIOps strategies in practice, not just how vendors describe it.
- Anomaly detection in infrastructure and applications
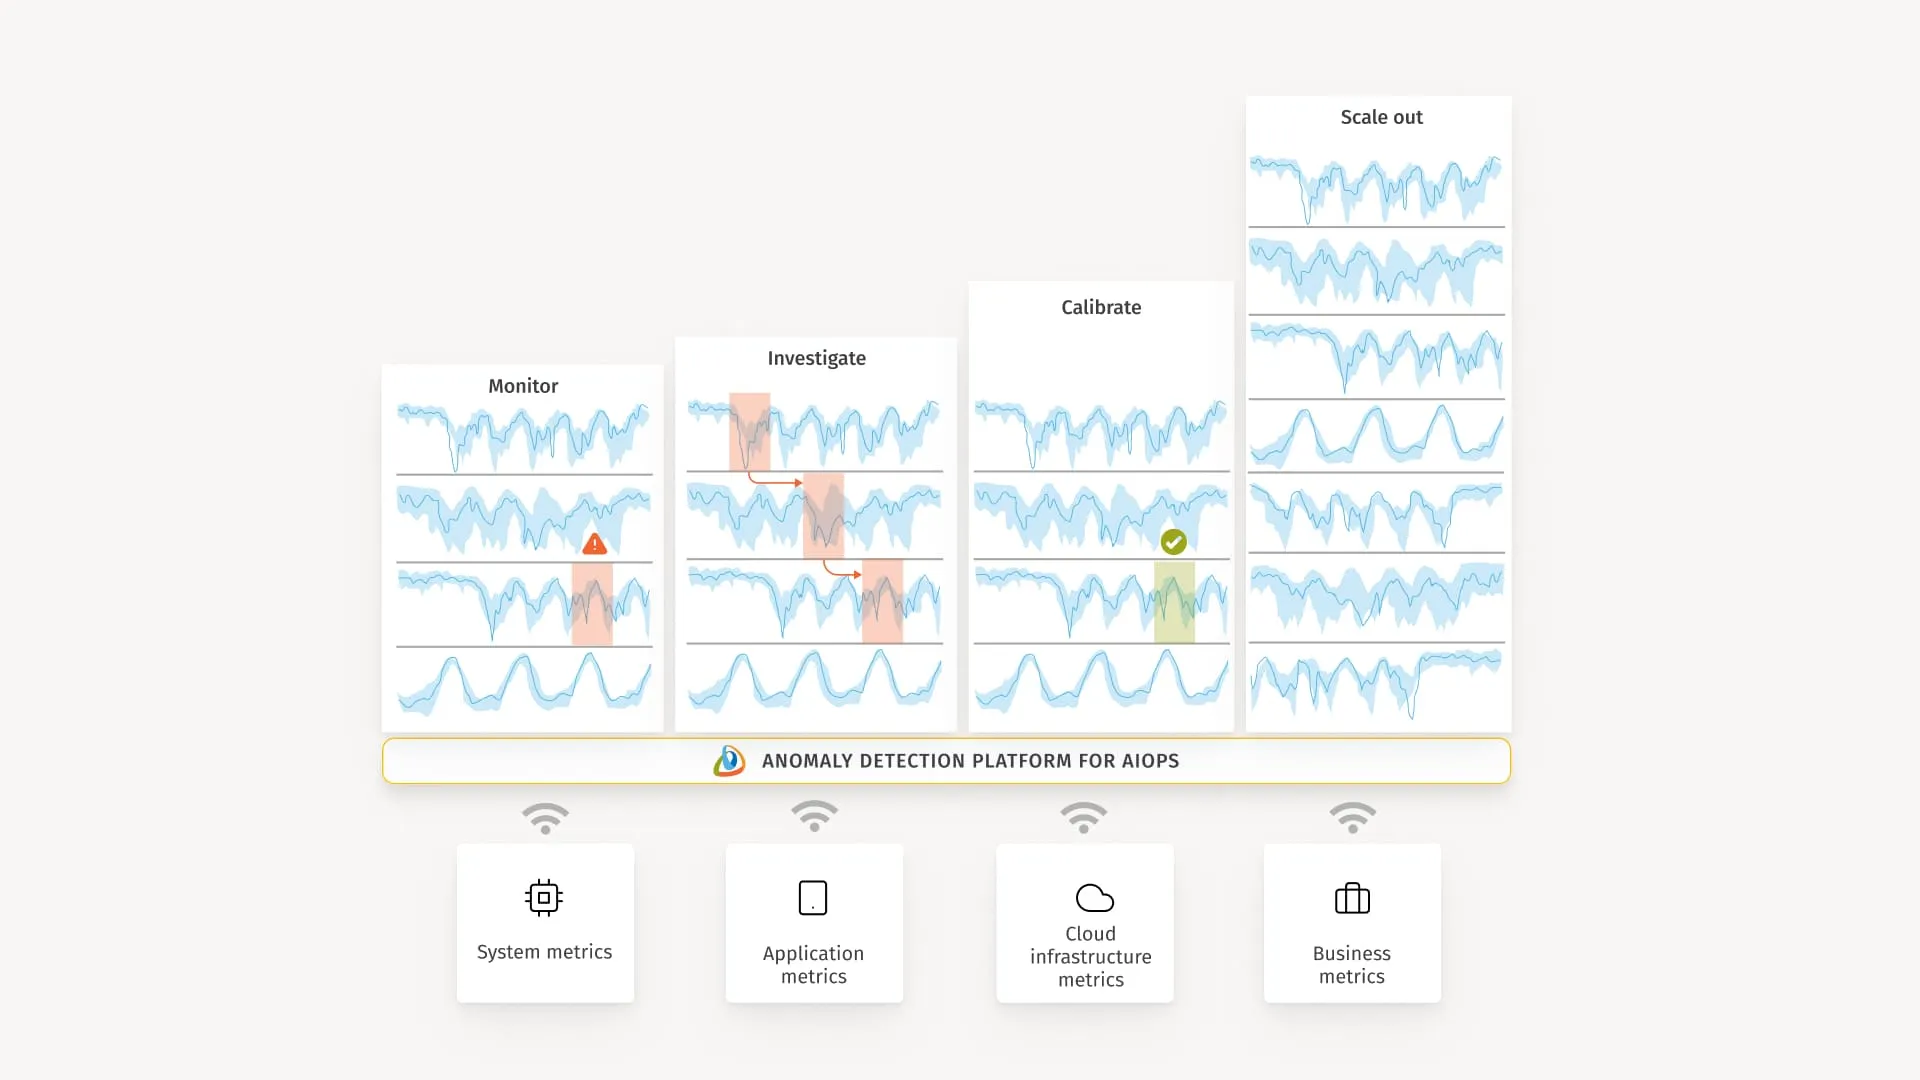
AIOps continuously analyzes metrics, logs, and traces to learn what “normal” looks like for each service, cluster, and component. Instead of relying on static thresholds, it detects unusual patterns in real time, even when values are technically within configured limits.
A 90% CPU reading during a flash sale is expected behavior. The same reading at 3 AM on a Tuesday probably signals a problem. Static rules can’t tell the difference. ML models can, because they build behavioral baselines for each metric, service, and time window, then score incoming telemetry against those baselines continuously.
In practice, this means:
- Detecting abnormal patterns in CPU, memory, latency, and error rates across services and environments
- Highlighting slow drifts like memory leaks or throughput degradation before they trigger outages
- Distinguishing genuine anomalies from routine operational events like blue-green deployments, auto-scaling actions, or rolling updates
- Surfacing unusual traffic spikes, suspicious access patterns, or misrouted requests that rule-based monitoring would miss.
In large eCommerce environments with hundreds of services on cloud infrastructure, this covers metrics across hundreds of VMs: CPU load, memory, disk I/O, network throughput, and load balancer performance. The detection algorithms have to account for constant code deployments, scaling events, and infrastructure shifts, or else they treat every release as an incident.
Anomaly detection also extends beyond infrastructure. In data lakes and warehouses, AIOps can analyze data profiles to catch incompleteness, inconsistencies, missing values, and outliers before those problems propagate through analytics pipelines or ML training workflows. In production, this often looks like an anomaly detection layer built into an AIOps SRE platform that flags deviating services before users notice a slowdown.
- Reducing alert storms in large-scale systems
Anomaly detection decides what gets flagged. Alert storm reduction handles what happens when a core dependency fails, and hundreds of those flags fire at once across different tools.
When a database goes down, every service that depends on it fires its own alert. A network issue in one availability zone can trigger hundreds of notifications across applications, APIs, and infrastructure simultaneously. Without correlation, the on-call engineer sees what appear to be dozens of separate, unrelated problems.
AIOps turns that flood into a manageable signal by correlating events and presenting a single, structured incident instead of a wall of noise:
- Correlates alerts from multiple monitoring systems into one incident when they share a common cause
- Suppresses duplicates and low-value notifications to shrink the volume reaching on-call engineers
- Prioritizes incidents based on business impact, affected services, and SLOs rather than raw alert count
The result is an improvement in signal-to-noise ratio, which directly affects how quickly teams respond to real incidents. Engineers using event correlation consistently report alert volume reductions that let them focus on genuine incidents instead of spending time triaging noise.
- Accelerating incident investigation
Even when teams know something is wrong, finding out ‘why’ can consume most of the incident timeline. A latency spike in one microservice might trace back to a database connection pool issue three layers deep in the dependency chain. Manually hopping between dashboards and comparing timestamps under the pressure of a live outage is slow, expensive, and error-prone.
AIOps compresses this process by:
- Maps anomaly propagation across infrastructure, from edge services through APIs and databases to underlying compute;
- Analyzes logs, metrics, and traces together, presenting a single timeline instead of separate dashboards;
- Uses topology maps and dependency graphs to work backward from symptoms to the most probable origin;
- Generates concise incident summaries that capture what happened, when, and where for SRE teams and incident commanders.
A practical example: a latency spike surfaces in a checkout service. AIOps traces the propagation back through the service mesh, identifies a database connection pool exhaustion in a downstream inventory service as the probable origin, and surfaces the correlated log entries that confirm the sequence, within minutes.
Some teams pair this with an AI assistant for cloud observability, so engineers can ask natural-language questions like “What changed before this spike on checkout?” and get targeted, data-backed answers.
- Automating incident response workflows
Detection and diagnosis only move the needle if someone acts on them quickly. In high-volume environments, manual ticket creation, team assignment, and runbook execution create response delays that directly consume error budget.
AIOps automates the handoff between detection and response by:
- Automatically creating enriched tickets in ITSM systems like ServiceNow or Jira with incident context, affected components, and probable cause already attached.
- Assigning incidents to the correct team based on service ownership, without requiring a human dispatcher.
- Triggering predefined runbooks for known incident patterns, such as restarting a degraded service or scaling out a node pool.
- Enriching tickets with relevant logs, trace IDs, and historical incident data to support faster resolution and consistent postmortem records.
The integration works in both directions. When an engineer resolves a ticket, that status flows back to the AIOps platform automatically. This keeps incident records consistent and useful for post-incident reviews because they’re populated with structured data from the start.
- Predicting infrastructure capacity issues
Capacity incidents often build slowly: a cluster runs hotter each week, or a storage volume moves toward its limit. Traditional monitoring only answers “what’s happening now,” not “what’s going to happen next week.” AIOps uses historical patterns to forecast these trends and flag problems long before users see errors.
- Forecast CPU, memory, or storage usage based on historical traffic and seasonal patterns.
- Predict when scaling will be required for seasonal events, product launches, or promotional campaigns.
- Identify inefficient resource allocations so teams can rightsize infrastructure and control costs.
- Flagging services approaching their limits before degradation starts, giving operations teams time to act without urgency.
This is where AIOps overlaps with FinOps. The same forecasting models that prevent capacity-related incidents also drive cost optimization by highlighting over-provisioned resources that waste budget and under-provisioned ones that risk degradation.
ML-based forecasting handles this better than static projections because it accounts for seasonality, workload variability, and shifting consumption patterns after major architectural changes or releases.
- Enabling self-healing infrastructure
For well-understood failure patterns, AIOps can go beyond tickets and trigger remediation directly. The key is using automation where the fix is predictable and safe, while keeping humans in the loop for anything ambiguous.
- Restarting failed or unresponsive services without human intervention.
- Triggering auto-scaling when resource consumption approaches predefined thresholds.
- Detecting and correcting configuration drift that causes services to diverge from their intended state.
- Applying automated remediation runbooks for repeatable incidents where the fix is safe to execute without human review.
In more mature implementations, this takes the form of specialized AI agents working together. An alert response agent classifies the incoming signal. An investigation agent runs root cause analysis against logs, metrics, and documentation. A runbook execution agent applies the fix under defined policy constraints. This setup compresses the path from alert to resolution, sometimes from over 20 minutes to under 5, while keeping human oversight in place.
Mature implementations follow a gradual trust path: start with suggested actions, move to one-click execution, and only then allow fully autonomous remediation for a controlled set of scenarios.
3 advanced AIOps use cases
The core use cases above rely primarily on statistical ML: pattern recognition, time-series analysis, and event correlation. They’ve been production-grade for years. The use cases in this section are different. They’re built on large language models and agentic AI architectures, and they change what AIOps can do rather than just doing the same things faster.
The distinction matters because LLMs and agents don’t just process structured telemetry. They understand unstructured text like runbooks, incident notes, chat transcripts, and postmortem reports. And agentic systems don’t just surface recommendations. They take multi-step actions across tools, with policy guardrails, without waiting for a human to copy-paste between dashboards.
These are still maturing, but they’re moving into production at the organizations with the most complex operational environments.
- Conversational observability and LLM-assisted troubleshooting
The core use cases described earlier assume an engineer who knows which dashboard to open, which query language to use, and how to interpret the results. That works for senior SREs who’ve built mental models of the system over the years. Such an assumption can break down for everyone else, and during high-pressure incidents, it can slow down even experienced engineers who are working outside their usual service domain.
LLM-based observability assistants change the interface. Instead of writing PromQL queries or navigating Grafana panels, an engineer asks a question in plain language: “What changed in the payment service before the error rate spiked at 2:15 PM?” The conversational AI agent retrieves relevant logs, metrics, and traces, synthesizes them, and returns a structured answer with supporting evidence.
But the value goes beyond query translation. These assistants can:
- Summarize an ongoing incident in real time, pulling context from alerts, recent deployments, and change events into a single narrative that anyone joining the response can read in thirty seconds
- Walk a less experienced engineer through a troubleshooting sequence step by step, suggesting what to check next based on what the telemetry shows
- Translate between audiences: generates a technical root cause summary for the engineering team and a business-impact summary for leadership from the same underlying data
This is a meaningful shift because it separates observability access from observability expertise. The data was always there. Conversational AI solutions make it usable by engineers who don’t have years of platform-specific knowledge. And from an LLMOps perspective, these agents require careful management: prompt tuning for domain-specific observability language,m latency budgets that match incident response timelines, and evaluation frameworks that verify the accuracy of retrieved telemetry against ground truth.
- Incident knowledge retrieval and contextual enrichment
The core automation use case (covered earlier) handles structured enrichment: attaching logs, metrics snapshots, and topology data to a ticket. That’s valuable, but it only covers what’s happening in the system right now.
LLM-powered enrichment adds a different dimension: institutional memory. Most organizations have years of postmortem reports, runbook documentation, Slack threads from past incidents, and wiki pages documenting known failure modes. That knowledge exists, but it’s scattered across tools and formats, and rarely gets consulted during a live outage.
LLMs change that because they can process unstructured text at scale. When a new incident fires, an LLM-powered enrichment layer can:
- Match the current incident’s symptoms against historical incidents and surface how similar problems were diagnosed and resolved before.
- Retrieve the specific runbook sections relevant to this failure mode, not just the runbook title, but the exact steps, pre-filled with context from the current incident (affected hosts, services, error codes).
- Extract relevant findings from past postmortems: “This service had a similar latency pattern in March, caused by a connection pool misconfiguration after a Kubernetes upgrade.”
- Suggest resolution paths ranked by how closely past resolutions match the current situation.
- AI-driven reliability engineering and proactive risk reduction
The core use cases are reactive by design: detect an anomaly, correlate alerts, investigate root cause, automate the fix. They make incident response faster. But they don’t reduce the number of incidents.
AI-driven reliability engineering flips that. Instead of waiting for something to break, it continuously analyzes system behavior, change history, and incident data to identify where the next failure is likely to come from.
This is where LLMs and agentic systems combine with traditional ML in interesting ways:
- Service risk scoring based on a combination of incident frequency, dependency complexity, deployment velocity, and observed failure patterns. This gives SRE teams a ranked view of which services are most likely to cause the next outage, so they can prioritize hardening efforts where they matter most.
- Change risk analysis, where the system evaluates an upcoming deployment against historical patterns. If code changes with similar characteristics have caused incidents before, the system flags the risk before the deploy goes out, not after.
- Automated postmortem synthesis, where LLMs process incident timelines, chat transcripts, and resolution logs to generate structured postmortem drafts. This doesn’t replace the human review, but it eliminates the hours of manual timeline reconstruction that typically delay the feedback loop from incident to improvement.
- Continuous reliability benchmarking that tracks error budget consumption, SLO trends, and toil metrics across services over time, surfacing degradation trends before they cross critical thresholds.
The long-term trajectory here is the most significant shift in AIOps. The goal moves from “respond to incidents faster” to “reduce the conditions that produce incidents in the first place.” That’s a fundamentally different value proposition, and it’s where LLM reasoning over historical patterns and agentic systems executing preventive actions start to compound.